Stability Metrics
Stability metrics evaluate price consistency and volatility over time. They quantify the risk that a token's value will move adversely, reducing collateral quality or triggering liquidations.
Metrics Reference
Stability Ratio
The ratio of the lowest price to the highest price over a rolling window.
Stability = low / high
Volatility proxy = 1 - Stability = (high - low) / high
A Stability Ratio of 0.90 means the asset traded within a 10% range. Values approaching 0 indicate high volatility. Used as a quick volatility proxy when full time-series data is unavailable.
Alpha Score
Measures how long a single entity maintains market leadership across a group. Computed as:
Alpha Score = days_in_leadership / total_days
A network or pool that leads in volume for 67 out of 100 days has an Alpha Score of 0.67. High Alpha Scores indicate persistent dominance — structurally important venues whose failure has outsized impact.
Value at Risk (VaR)
The maximum expected loss at a given confidence level and time horizon, modeled using Monte Carlo simulation. Bitpulse computes both Collateral VaR and Loan VaR across multiple time horizons (1-day, 7-day, 30-day).
Supported models:
- GBM (Geometric Brownian Motion) — standard baseline
- GBM+VIX — volatility-adjusted using the VIX index
- GARCH — captures volatility clustering (heavy tails)
- Historical — replays actual price path distributions
See the Risk API — VaR endpoint for full parameter reference.
Conditional Value at Risk (CVaR)
The expected loss given that a loss exceeds the VaR threshold. Also called Expected Shortfall. More conservative than VaR — captures the severity of tail events, not just their probability.
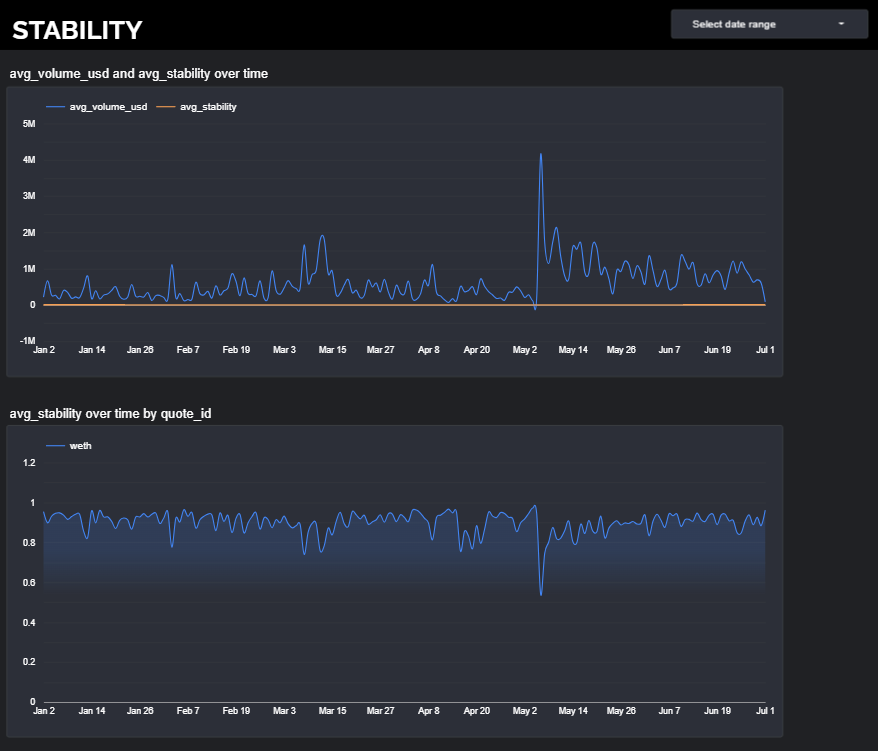
Example dashboard: